


(Bollinger Band) Brin Channel
2026-11-16 17:16|35 views
BOLL
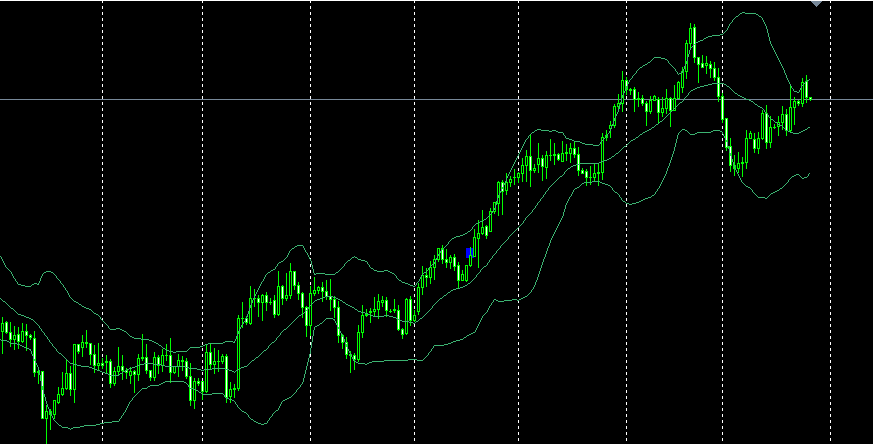
the indicator is an American financial analyst John? Brin designed a very simple and practical technical analysis indicator based on the principle of standard deviation in statistics. Generally speaking, the price movement always revolves around a certain value center (such as moving average, cost line, etc.) within a certain range. The Bollinger Bands index index introduces the concept of "price channel" on the basis of the above conditions. It believes that the width of the price channel changes with the magnitude of the price fluctuation, and the price channel has variability, It will automatically adjust with the change of price. It is precisely because of its flexibility, intuitiveness and trendiness that the BOLL indicator has gradually become a popular market indicator widely used by investors. Its principle: the movement of prices always fluctuates within a certain range around a certain value center (moving average). It consists of three parts: upper rail, middle rail and lower rail. As shown in the figure:
Main functions
1. Bollinger Bands can indicate the position of support and pressure;
The Bollinger Bands can show overbought, oversold;
The Bollinger Bands can indicate trends;
4. Bollinger Bands have channel function.
The principle of the theoretical use of the Bollinger Bands is that when the price crosses the outermost pressure line (support line), it indicates that the selling point (buy point) appears. When the price rises (falls) along the pressure line (support line), although the price has not crossed, if it breaks the second line back, it is a selling point or a buying point.
Research and judgment method
Normally, prices fluctuate up and down within the Bollinger Bands, so when investors are unable to determine the direction of market volatility, the bottom section of the channel and the top of the channel are the upper and lower limits of several fluctuations, and when the price rises to the top of the Bollinger Bands, there will be greater resistance. On the contrary, when the price fluctuates to the bottom of the channel, it will be greatly supported.
In the process of price fluctuation, if the upper and lower channels move closer to the middle 20-period moving average, the fluctuation range of the price will be reduced. When the price breaks the upper channel or the lower channel, it generally indicates that the price will have a wave. Investors should choose to buy or sell according to the actual situation.
Special Application Methods
1. Use the relationship between the upper, middle and lower tracks.
When the upper, middle and lower tracks run upward (downward) at the same time, it indicates that the price is strong (weak) characteristics are very obvious, the price will continue to rise (fall) in the short term, investors should firmly hold positions to rise (hold the currency to wait and see) or buy on dips (sell on high).
When the upper track of the Bollinger Bands runs downward, while the middle and lower tracks are still running upward, it indicates that the price is in a consolidation trend, and if the price is in a long-term upward trend, it indicates that the price is a strong consolidation on the way up, and investors can hold their positions and wait and see or buy on dips, and vice versa.
When the three tracks run horizontally, it is necessary to judge whether the previous trend is the bottoming stage after the long-term decline or the correction finishing stage after the medium-term decline with other indicators to judge the future trend.
2. Combination of BOLL index and K line:
When the K line breaks through the middle track of the Bollinger Bands from the bottom up, it indicates that the strong characteristics of the price are beginning to appear, and it is appropriate to buy mainly in the medium and long term.
When the price runs in the area between the boll mid-rail and the upper rail, especially the boll angle is above 45 degrees, and the k-line is close to the boll upper rail, indicating that the market is in a long market, at this time should be bought at low prices.
When the price moves out of the BOLL upper and lower lines, it indicates that the current price change may continue. Observe the trajectory of the three tracks, whether they are together upward and downward or divergent. When the K line turns around and breaks the upper and lower lines, it indicates that the short-term strong or weak market of the price may end.
3. Research and judgment of the "bell mouth" of the Bollinger Bands
The so-called "bell mouth" of the Bollinger Bands refers to the special shape similar to the bell mouth formed by the large expansion or convergence of the upper and lower tracks of the Bollinger Bands from two opposite directions and the middle track during the operation of the gold price. According to the different running directions and positions of the upper and lower tracks of the Bollinger Bands, we can divide the "bell mouth" into three types: open bell mouth, closed bell mouth and tight bell mouth. Open bell mouth form often appears in the gold short-term surge in the early stage of the market, closed bell mouth form often appears in the early stage of the gold crash market, tight bell mouth form often appears in the end of the gold price fell sharply.
An open bell is a form that shows a sharp upward breakout of the gold price in the short term. It is formed in the gold price after a long period of low horizontal bottom, facing an upward change when the trend. The upper and lower track lines of the Bollinger Bands appear in opposite directions but with great strength, indicating that the long power is gradually strong and the short power is gradually exhausted, and the gold price will be in the short-term sharp rise in the market. The formation of the open bell mouth form must have two conditions. One is that the gold price has to go through a long period of mid-to-low horizontal consolidation. The longer the consolidation time and the smaller the distance between the upper and lower tracks, the greater the future rise; the second is that when the Bollinger Bands begin to open, there must be obvious Large trading volume appears.
The closing bell shape often appears in the early stages of a plunge. Although the formation of its form does not require trading volume, it must also have a condition, that is, the price after a large short-term pull up in the early stage, the greater the pull up, the greater the distance between the upper and lower tracks, the greater the future decline.
The tight-mouthed bell-mouth pattern appears at the end of a significant price decline. Its formation conditions and confirmation standards are relatively loose, as long as the price after a long period of sharp decline, the transaction is extremely shrinking, the distance between the upper and lower tracks is getting smaller and smaller when the initial formation of the tight-mouthed bell mouth can be determined. When a tight-mouthed bell appears, investors can either wait and see or build a small position.
Precautions
When the price goes up and down for a period of time, it will enter a shock rest within a range, the price area of the shock will become smaller and smaller, and the boll channel will be represented by the upper, middle and lower track necking. This state is a harbinger of the arrival of the big market, at this time we adopt the trading strategy is a short position to wait and see the rest. When the difference between the upper and lower rail values is close to 10%, it can be set as the best time to buy and sell.
Mr. JohnBollinger, the inventor of the sub-indicator for the BOLL channel, suggested using a weighting of 20, I .e. a 20-day moving average. Use standard discrete values of 20 unknowns. For this, some people can't help but ask: why not use longer days and shorter days? Of course, using longer days can be counted to more points of data. However, this will make the standard discrete value and the gold price not appropriate enough and the consequences can be imagined. The use of shorter days is certainly more relevant to changes in gold prices, but it loses statistical significance-in order to balance these two contradictions, I agree with the inventor's proposal. That is, using a 20-day moving average weight.