


gap theory
2026-11-16 17:16|29 views
A gap is a period of rapid and large price movement without any trading, which is shown on the price trend chart as a vacuum area, which is called a "gap" and is often referred to as a gap. When there is a gap in the price, after a few days, or even longer, and then reverses and returns to the price of the original gap, it is called the closing of the gap. The gap is divided into four types: ordinary gap, breakthrough gap, persistent gap and expendable gap. From the size of the position where the gap occurs, you can predict the strength of the trend and determine whether it is a breakthrough or the end of the trend. It is the most powerful auxiliary material when studying various forms. The gap in the K-line chart refers to a phenomenon in which the price rises or falls sharply due to the influence of good or bad news, resulting in the daily K-line chart showing a graphical pattern in which the lowest price of the day exceeds the highest price of the previous trading day or the highest price of the day is lower than the lowest price of the previous trading day.
Type of notch
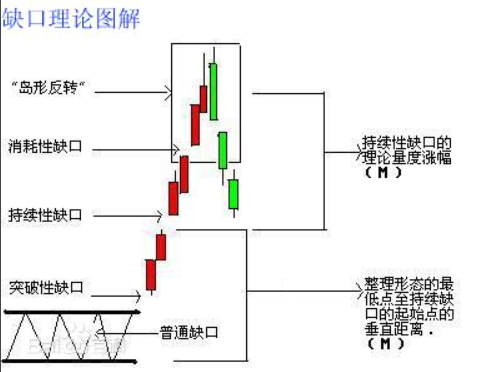
Ordinary Gap
The analytical value of the ordinary gap is relatively low, generally refers to the occasional jump in the horizontal finishing, and will soon be filled back, the trend of the study of little effect.
Break through the gap
A breakout gap is a gap created when a dense reversal or finishing pattern is completed to break through the plate. When the price jumps away from the pattern by a large gap, it means that a real breakthrough has been formed. Because the wrong movement rarely creates a gap, and the gap can show the strength of the breakthrough, the larger the breakthrough gap indicates a strong change in the future.
Persistent Gap
A gap on the way up or down may be a persistent gap. This gap is not to be confused with breaking the gap. Any sharp rise or fall after leaving a pattern or dense trading area is mostly a persistent gap. This gap helps us estimate the magnitude of future market volatility and is therefore also known as a measurement gap.
Expendable gap (exhaustion gap, exhaustion gap)
As with persistent gaps, expendable gaps occur with rapid, large price volatility. In a rapid rise or fall, the price fluctuations are not gradually resistance, but more and more urgent. This is when a jump in price (or a jump down) may occur, and this gap is an expendable gap. Usually expendable gaps occur mostly at the end of a panic sell-off or expendable rise, so they are also called exhaustion gaps or exhaustion gaps.
Key points
① The general gap will be filled. Because the gap is a vacuum area with no transactions, reflecting the impulsive behavior of investors at the time, when the investment mood calms down, investors reflect on past behavior is a bit excessive, so the gap is closed. In fact, not all types of gaps will be filled, of which breakthrough gaps and persistent gaps may not be filled. At least not immediately filled. Only expendable and ordinary gaps can be filled in the short term, so whether the gap is filled or not is of little help to the analyst's observation of the post-market.
② Whether the breakthrough gap will be filled immediately after it appears, we can observe from the change in volume. If there are a large number of transactions before the breakthrough gap occurs and the number of transactions decreases relatively after the gap occurs, then the chance of filling the gap immediately is only a ratio of 50 to 50. However, if the number of transactions increases greatly after the gap is formed, and the price still maintains a very large number of transactions when it continues to move away from the form, the possibility of short-term filling of the gap will be very low. Even if there is a pullback, it will be outside the gap.
③The price rises sharply when it breaks through its area, the volume of trading is large in the initial stage, and then decreases in the rise, and when the price stops the original trend, the volume of trading increases rapidly, which is the result of fierce competition between the two sides. After one of the parties got a landslide victory, a huge gap was formed, and at this time it began to decrease again. This is the change in volume when a persistent gap is formed.
The consumptive gap is usually the highest volume on the day when the gap is formed (but it may also occur on the day after the highest volume), followed by a decrease in transactions, indicating that the market's purchasing power (or selling power) has been exhausted, so the price quickly falls back (or rises).
⑤ The more gaps appear during a rise or fall, the faster the trend is approaching its end. For example, when the third gap appears in the market, it implies that the market is coming to an end; when the fourth gap appears, the possibility of short-term decline is even stronger.
application skills
A gap, also known as a jump, is a technical graphic that often occurs during the continuation of the market. When a gap appears, the market tends to move rapidly in a certain direction, and the gap becomes a stronger area of support or resistance in the future. Therefore, the use of gap theory to study the general trend of the market is an important means in the process of futures trading.
1. common gap
Ordinary gap refers to the gap without special shape or special function, it can appear in any trend pattern, but most of them appear in the market of finishing pattern. It has a more obvious feature, that is, the gap will soon be filled. Since futures are traded in both directions, investors can take advantage of this feature to take advantage of some short-term operating opportunities.
When the ordinary gap in the upward direction appears, the investor can make a sell trade near the relative high above the gap, and then close the position to buy back after the gap is closed, while when the ordinary gap in the downward direction appears, the investor can make a buy trade near the relative low below the gap, and then close the position to sell after the gap is closed.
The premise of this method of operation is that it is necessary to determine whether the gap is an ordinary gap, and it must be in the wide oscillation to sort out the market in order to adopt this strategy of high selling and low sucking.
2. Breakthrough Gap
Breakthrough gap refers to the market to a certain direction of rapid movement, out of the original form of the formation of the gap. The emergence of the breakthrough gap indicates that there will be a wave of explosive market in the future, so the analysis of the breakthrough gap is of great significance. There are two kinds of breakthrough gaps, one is upward breakthrough gap, the other is downward breakthrough gap. The following is a brief analysis of the application of the breakthrough gap in futures trading in conjunction with the technical trend of soybeans in May:
1. Break through the gap upward. The gap is characterized by a significant increase in volume at the time of the breakthrough and the gap is not closed. When the gap occurs, investors can boldly buy the mid-line hold and use the gap as a stop-loss level for risk control. 2. Break the gap downward. The gap is characterized by a significant increase in volume during a downward breakout and the gap is not closed. As the downward force of the market is often fierce, once the downward breakthrough gap is formed, the lethality is relatively large, which should be paid enough attention.
When the downward breakthrough gap appears, if the investor holds a long order, he should immediately stop the loss decisively and backhand short; if the investor holds a short order, he can continue to increase the code and sell, and hold in the middle line, with the gap as the stop-loss price for risk control. When the downward breakthrough gap is formed, the market trend is bound to develop in depth and embark on the bear road of no return.
Persistent Gap Tips:
A persistent gap "refers to a gap that occurs during a rise or fall, and a persistent gap often forms between the beginning and end of a sharp price fluctuation.
A persistent gap is also known as a measurement gap, where the price reaches the gap and may continue to move by an amount generally equal to the amount by which the price jumps from the beginning to that gap. Such jumps reflect that the market is developing smoothly with moderate trading volume. In an uptrend, the appearance of a measurement gap indicates a firm market, while in a downtrend, it indicates a weak market. As in the case of a breakout jump, in an uptrend, sustained jumps will form a support zone in the subsequent market correction, and they are usually not filled back, and once the price returns below the relay jump, that is a negative signal for the uptrend.
Expendable gap
Expendable Gap Tips:
The price in the process of large fluctuations in the moribund price in the last jump, however, the final struggle did not last long, in the following days or even a week of the price immediately began to decline. When the closing price falls below this final jump, it indicates that a depletion jump has been formed, so an expendable gap is also known as a depletion gap.
The above situation is very typical, indicating that in an uptrend, if the gap is filled back, it usually has a weak meaning, indicating that the short-term head has been formed and the bulls have completed the final blow. The analytical significance of the expendable gap is to indicate that the force to maintain the original trend of movement has weakened and that prices are about to enter a consolidation or reversal pattern.