


Gann Theory
2026-11-16 17:16|30 views
Gann's theory holds that there are also natural rules in the universe in financial markets, and that the trend of price movement in the market is not messy, but can be predicted mathematically. Its essence is to establish a strict trading order in a seemingly disorderly market, which can be used to find out when the price will be adjusted back and to what level.
Capital loss factor
Factor one
1, excessive trading on limited capital. That is to say, the operation is too frequent. Short-term and ultra-short-term in the market require high operating skills. Before investors have mastered these operating skills, too much emphasis on short-term will often lead to considerable losses.
Factor two
2, investors did not set up stop-loss points to control losses. Many investors suffer huge losses because they do not set the right stop-loss points, and as a result, their mistakes are allowed to develop indefinitely and the losses are getting bigger and bigger. Therefore, learning to set stop-loss points to control risk is one of the basic skills that investors must learn. There are also some investors, even some market veterans, who have set stop-loss points, but do not resolutely implement them in actual operation. As a result, they suffer huge losses due to a difference in thinking.
Factor three
3. Lack of market knowledge is the most important reason for losses in market trading. Some investors do not pay attention to learning market knowledge, but take things for granted or subjectively think how the market is, will not distinguish the authenticity of the news, the result of misguidance, suffered huge losses. There are also some investors who only rely on some knowledge learned from books to guide practice, and apply it indiscriminantly, causing huge losses. Gann's emphasis is on market knowledge, practical experience. And this kind of market knowledge often takes quite a bit of time in the market to really experience it.
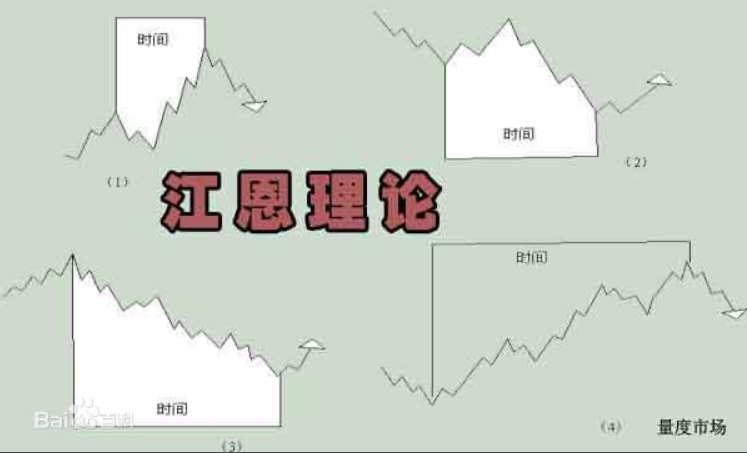
cycle theory
Gann's circular theory is a summary of the entire Gann idea and its years of investment experience.
Gann extrapolated his theory in terms of circles, squares, and hexagons that unfolded according to certain laws. These graphs include concepts such as the law of time, the law of price, the geometric angle, and the callback belt in Gann's theory, which graphically reveal the laws of the operation of market prices.
Gann believes that the more important cycles are:
short-term cycle: 1 hour, 2 hours, 4 hours,... 18 hours, 24 hours, 3 weeks, 7 weeks, 13 weeks, 15 weeks, 3 months, 7 months;
Medium-term cycle: 1 year, 2 years, 3 years, 5 years, 7 years, 10 years, 13 years, 15 years;
Long-term cycles: 20 years, 30 years, 45 years, 49 years, 60 years, 82 or 84 years, 90 years, 100 years.
The 30-year cycle is an important basis for Gann's analysis, because there are 360 months in 30 years, which is exactly a 360-degree circular cycle. According to Gann's price band theory, 1/8, 2/8, 3/8... 7/8, etc. can exactly get Gann's long-term, medium-term and short-term cycles.
The 10-year cycle is also an important basis for Gann's analysis, which argues that the 10-year cycle can reproduce the market cycle. For example, a new historical low will occur ten years after a historical high, and conversely, a new historical high will occur after a historical low. At the same time, Gann pointed out that any long-term upward trend or downward trend cannot last for more than three years without adjustment, and there must be three to six months of adjustment during this period. Thus, the upward course of the ten-year cycle is actually a top every three years for the first six years and a final top for the last four years.
There is some quantitative connection between the above-mentioned cycle periods of different lengths, such as a multiple relationship or a square relationship. Gann shows these relationships in circles, squares, hexagons, etc., providing a powerful tool for correctly predicting financial market movements.
Analysts who use cycle theory as their main tool believe that the final clue to market movements lies in their operating cycles. It is undeniable that the research results of time period have added time dimension to our market measurement methods. As a theory, after continuous enrichment and development, it is understandable that it has become complicated and esoteric; as a means, its existence and development must have its special reasons, but any kind of technology will be due to its own advantages and disadvantages, gains and losses. Here, the author seeks to concise language and friends to exchange the application of its core content.
In general, cycle analysts believe that troughs are more reliable than peaks, so the measurement of cycle length is carried out from trough to trough, probably because the vast majority of cycle variation occurs on the peak, that is, the formation of the peak is more complex, and therefore the trough is considered more reliable. From the practical application results, the cycle analysis is far better in the bull market than in the bear market. The reason, in my opinion, is related to the tendency of cycle theory research to focus on the bottom. At the same time, the author found that in the bull market, the time for the formation or residence of the wave trough is relatively shorter than that of the wave crest, and the wave crest becomes more complicated because of the strong consolidation trend, so it is more difficult to grasp. In a bear market, the opposite is true, because the market is weak, the market often replaces the rebound with a consolidation pattern, so the peak is shorter than the trough formation time, easy to find. In the use of cycle theory to measure the market, the bull market to measure the trough method is more accurate, the bear market to measure the crest method to win a bit more. The reason why the author tends to measure the form with a shorter construction time is that such a form is easier to distinguish, and the deviation between the predicted time target and the actual occurrence time is small. Interested friends may wish to give it a try.
When deciding whether to use the peak measurement method or the valley measurement method, besides using the trend line to filter, there is another method that can also give you great help, that is, first observe whether the peak moves left or right to the middle line of the cycle time in the previous level cycle, that is, if a rise and fall cycle is 40 days, whether the peak moves forward or backward to 20 days, the left is bearish, and the right is bullish. Peak measurement is used when bearish and valley measurement when bullish. As one of the auxiliary tools, the left and right shift of the wave crest is suitable for periods of any trend and length. There are four important basic principles in cycle theory: the superposition principle, the harmonic principle, the synchronization principle, the proportional principle, and two general principles: the alternative principle and the benchmark principle, which are not repeated in this paper.
About the time period, you can not fail to mention the magic Fibonacci sequence 1, 1, 2, 3, 5, 8, 13, 21, 34, 55, 89, 144 ......, the relationship between this group of numbers, there are books monograph, this article does not describe in detail. Because it is the basis of wave theory, wave theory and cycle theory are also quite related, in the use of cycle theory to measure the market, whether from the top or bottom of the important market to the future, to arrive at the Fibonacci time target, these days may mean to become an important turning point in the market. In these time windows, how to obtain trading signals, but also need to be supplemented by other technical means to verify. As for the magic number, the author has a tacit understanding from Gann's theory and his novels. Gann regards the cycle of "7" and its multiples as an important turning point. The author found that if this number is Fibonacci number × 7, then this number is even more magical.How do we understand the number "7"? In Gann's eyes, God created the world in 7 days, so "7" is a complete number. In the Bible, the fear of death, the greatest enemy of mankind, can also be overcome. Jesus stood up on the 3rd day after death and resurrected on the 7th day. This means that 7 days are a cycle and "3" is the Fibonacci number, even the "4" is quite extraordinary. The earth's rotation is 360 degrees per week and 1 degree per 4 minutes. Therefore, the shortest cycle can be 4 minutes. The earth's rotation takes another 24 hours per week, which is also a multiple of 4. Therefore, the 4 × 7-day cycle is also a very important short-term cycle. The above series of numbers constitute the time window of price changes, once the market enters the time window, we also have to rely on other technical tools to do filters, such as swing indicators KDJ, W%, RSI, etc., to filter pseudo-miscellaneous information to determine the occurrence of turning points, and to get trading signals. In particular, it should be noted that when applying the cycle theory and wave theory Fibonacci series, it should be noted that they are all based on group psychology, that is, the larger the market size, the more the number of participants, the more in line with the above theory, and the wave theory is also intended to be applied to the average index of financial markets. At this point, we will find that the magic number mentioned above is even more magical.
callback rule
A pullback is a temporary reversal of the price in the form of the main movement. The callback theory is the most important part of Gann's price theory. According to the concept of the price level, 50%, 68%, 100 as a callback position is a strong support or resistance to the price movement trend.
Gann's 50% callback rule is based on Gann's concept of 50% callback or 63% callback.
Gann believes that whether the price rises or falls, 50%, 63% and 100 are the most important in Gann price. They correspond to geometric angles of 45, 63 and 90 respectively. These prices are usually used to determine the establishment of a 50% callback band.
law of fluctuation
In the First World War, a group of German soldiers walked neatly across a bridge, only to crush it. As far as the load capacity of the bridge itself is concerned, it is far greater than the weight of this group of German soldiers. However, due to the neat pace and consistent rhythm of the soldiers, the bridge collapsed under the action of this concerted force, which is the effect of resonance. Resonance is often used in the field of sound. Resonance occurs when there is a multiple of the short frequency and the long frequency.
Gann's thinking is that the volatility or inherent cyclical factors of the market come from the multiple relationship between market time and price. When the frequency of internal fluctuations in the market is multiplied by the frequency of external market driving forces, the market will have a resonance relationship, so that the market has a huge upward or downward effect.
Looking back at the historical trend, we can find that: the trading market trend often ups and downs, once from the low start, produce upward breakthrough, the price is like a runaway wild horse galloping up; and once from the high to produce a downward breakthrough, the price is like a burst of river water. This is the reflection of resonance in financial markets.
Resonance can generate a potential, and once this potential is generated, it has great power up and down. It can trigger people's emotions and operational behavior, resulting in a one-sided situation. When it goes up, people are in high spirits and rush into the market; when it goes down, everyone panics and prices are plummeting, as if at the end of the world, which Gann calls a price collapse.
Therefore, an investor should pay full attention to the resonance phenomenon. Resonance may be caused by the following conditions:
1. When long-term investors, medium-term investors, and short-term investors are buying or selling in the same direction at the same point in time, there will be an upward or downward resonance;
2. When the long period, medium period and short period in the time period converge to the same time point and the direction is the same, the time point of upward or downward resonance will be generated;
3. When the long-term moving average, medium-term moving average, and short-term moving average converge to the same price point and have the same aspect, an upward or downward resonant price point will be produced;
4. When the K-line system, the moving average system, the volume KDJ indicator, the MACD indicator, the Bollinger Bands indicator and other technical indicators are issued a buy or sell signal, the resonance point of the technical analysis indicator will be generated;
5. When financial policy, fiscal policy, economic policy and other policies are consistent, there will be a resonance point of policy;
6. When the fundamental and technical directions are consistent, a great resonance point will be produced;
7. When the fundamental situation, operation, management, financial situation and cycle situation of a listed company are in the same direction, the resonance point of this listed company will be produced.
Resonance does not occur at any time, but is conditional. When these conditions are met, resonance can occur; when the conditions are not met, resonance will not occur; when some conditions are met, resonance will also occur, but the effect is Small; when the more conditions of resonance are met, the greater the power of resonance. In many cases, many conditions have been met, but resonance has not occurred. This can be understood as everything is ready and only the east wind is needed. If the east wind does not blow, the fire will not burn, and the east wind is the key condition. Without the key conditions, resonance would not be able to occur, at which point Gann placed particular emphasis on the forces of nature.
We know that every lunar August 18 Qiantang River will have a tide, this phenomenon is caused by the gravity of the moon. This kind of spring tide only occurs when the sun, moon and earth are in the same straight line, which is also a kind of resonance. Since the positions of the sun, the moon and the earth can cause great tides, can their positions also affect people's operating emotions and behaviors? Gann's answer is yes.
In short, resonance is an important factor that makes prices fluctuate significantly, and investors can consider the relationship between short-term, medium-term and long-term frequencies and their multiples. Gann also believes that the external factors of the market come from the natural cycle and the time cycle of the earth's seasonal changes. Resonance is a resultant force, a force that occurs at the same time in which multiple forces are pushed to the same direction. Once investors find this point, they will be able to make huge profits and avoid huge risks.
Split ratio
Gann's law of fluctuations contains a very wide range of content, but when Gann was alive, no clear definition of the law of fluctuations was given, which resulted in
Later analysts who studied Gann's theory had different understandings of the law of fluctuations. Peter, a musician and speculator, once wrote an article explaining the law of fluctuation from the perspective of music theory. According to Peter, Gann's theory and music theory are in the same vein, and both are different understandings of the law of fluctuations. The basic structure of the syllable consists of seven scales, in which the resonance occurs between C and G and the high octave of C, that is, the ten percent and double levels. In other words, the scale resonates in the form of 1/2, 1/3, 1/4, and 1/8, so that one, two, four, and eight times the frequency resonates. The above ratios and multiples are closely related to Gann's fluctuation law, which is Gann's split ratio.
Gann's split ratio is based on 8, that is, Gann's split ratio is 50% (1/2), followed by 25% (1/4) and 75% (3/4), followed by 1/8, 3/8, 5/8 and 7/8. When we study the charts of the Shenzhen and Shanghai financial markets, we can find a large number of practical examples to prove the effectiveness of the Gann split ratio.
Gann's experience is summed up from the U.S. financial market and the futures market, but this conclusion is also applicable to the Chinese financial market. Gann's fluctuation law and division ratio are not limited to a specific area, it is a natural law, and this natural law is a law that people naturally follow in the process of trading, it is a reflection of people's fixed habits, and this fixed habit is not easily broken. If a pair of soldiers to carry out the task from place A to place B, because of the long journey, need to rest in the middle, then the resting place was probably chosen at the 50% of the total distance. Another example is a person who works eight hours a day, so his working schedule is often four hours in the morning and four hours in the afternoon.
Gann's fluctuation law places great emphasis on the fractional relationship between the multiple relationship and the split ratio, and the multiple relationship and the fractional relationship can be transformed into each other, depending on the size of the value we take.
When we understand the importance of this multiple and fractional relationship, we can use it to establish a market framework, when the time and price units are running to this multiple and fractional relationship, the turning point of the market may have been reached. There will be natural support and resistance in terms of price, and resistance in terms of time. Starting at important lows in the market, calculating 1/2, 1/4, 1/8 growth levels, and doubling, doubling, quadrupling, and eightfold positions, will likely be important support and resistance. In the low area, the trend is often subject to 1/8 resistance, small fluctuations, long time, the trend is repeated, once the effective breakthrough, the resistance is reduced, the trend is bright. In the important high point of the market, the calculation of the 1/2, 1/3, 1/4 and 1/8 of the position is often an important support for adjustment. Dividing the range of the important low to high point of the price into eight parts, the position of segmentation is an important support and resistance. For the time cycle, a circular 360 degree can be regarded as the unit of the time cycle of the market, and divided into 180 degrees, 90 degrees and 45 degrees with the ratio of 1/2, 1/4 and 1/8, including the cycle unit of month, week and date. The position of segmentation often becomes an important turning point of the market cycle.