


Zero basic science precious metal technical analysis: essential tools and basic concepts detailed.
2026-11-16 17:16|23 views
Technical analysis is an analytical method that uses historical price and volume data to determine market trends. Even if you learn from scratch, as long as you master the key tools and concepts, you can initially analyze the London gold, London silver and other precious metals market.
Commonly used tools include price charts (e. g. K line graph), trend lines, support/resistance lines, and various technical indicators (such average (MA), relative Strength Indicator (RSI), MACD, bollinger Bands etc.).
These tools can help investors identify up or down market trends, determine overbought and oversold conditions, and capture price reversal signals to provide a basis for making buying and selling strategies.
For example, as an important global spot gold indicator, the price trend of London gold is influenced by market hotspots and technical patterns, and mastering technical analysis can help investors go long in an uptrend, short in a downtrend, or grasp support and resistance trading opportunities within a consolidation range.
1. common analysis tools and charts
K line chart (Candlestick Chart): K-line chart is the basic chart of technical analysis, each K-line represents the opening price, closing price, high price and low price in a time period (e. g. daily line, hour line). The solid part (red or green) indicates the price range between the opening and closing, and the upper and lower hatches indicate the highest/lowest prices of the day.
For example, the continuous appearance of red with a long shadow line" hammerhead line"tend to signal a possible rebound after a decline, while" engulfed form"It is common when the trend reverses. Changes in market sentiment can be visually judged by observing the color, pattern and combination of K lines (e. g., hammerhead, doji, engulf, etc.).
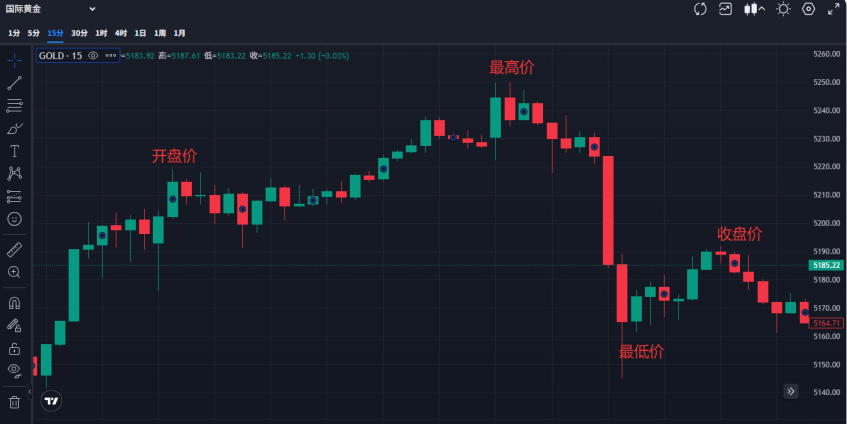
Figure: An example of a typical precious metal K line chart, each candle (red/green bar) shows the opening, closing, high and low prices. Investors can judge trend and reversal signals by observing the pattern and color changes of the K chart.
Trend line (Trendlines): Connect the connected troughs or peaks on the chart to form an uptrend line or a downtrend line, respectively. The uptrend line consists of a series of upward-moving lows, indicating strong buying power; the downtrend line consists of downward-moving highs, indicating that selling pressure prevails. Trend lines can be seen as dynamic support or resistance lines, often accompanied by price rebounds or falls when touched.
Support/Resistance Lines (Support/Resistance): Support level refers to the price level that may stop falling and recover in the process of price decline, and resistance level refers to the price level that may be blocked from falling in the process of price increase. They often correspond to areas where prices have historically rebounded or fallen many times and are an important reference for technical analysis to determine the timing of buying and selling. In the horizontal finishing stage, you can "copy the bottom and throw high": in. Buy near support levels, in sell near resistance level. When prices break through these key levels, they may also trigger a new round of trends ( breakout Trading Strategy), such as upward acceleration after breaking resistance.
Trading Software and Platforms: Modern investors often use professional software (such as MetaTrader 4/5, TradingView, etc.) or mobile phone App to view real-time precious metal quotes and draw technical charts. These tools provide multi-period K-lines, rich technical indicators and graphical plotting functions to facilitate tracking and analysis in the global 24-hour market. For example, on the mobile phone screen shown in the figure, investors can view the London gold movement, K-line pattern and volume chart through the App, and adjust their position strategy instantly.
Analysis of Key Technical Indicators of 2.
Moving Average (MA): The moving average is the most commonly used trend-following indicator. By calculating the average price over a period of time, MA can smooth out price fluctuations and help determine the direction of the trend. Common are simple moving averages (SMA) and exponential moving averages (EMA). When a short-term MA is worn on a long-term MA ("golden cross"), it usually implies a bullish trend; when it is worn down ("dead cross"), it indicates a bearish trend.
Relative Strength Index (RSI): RSI is a measure of price momentum with values between 0-100. It is generally believed that when the RSI is above 70, the market may have been. Overbought, below 30 or already oversold. For example, if the RSI enters the overbought zone at the end of the rally, it may indicate weakness in the rally and the need to be wary of a correction, while if the RSI is oversold in the downside, there may be a rebound opportunity.
MACD (Smoothed Similarities and Similarities Moving Average): MACD consists of a "fast line" (EMA difference) and a "slow line" with a histogram, which is often used to identify momentum changes. A buy signal (bullish) is generated when a fast line crosses a slow line from the bottom up; a reverse cross generates a sell signal. The expansion or contraction of the MACD histogram reflects the strength of the trend and helps investors confirm the strength of the trend.
Bollinger Bands (Bollinger Bands): The Bollinger Bands consist of a medium track (usually a 20-day moving average) and two standard deviation tracks up and down, which show the range of price fluctuations. When the price hits the upper rail, it indicates that the market may overheating, there is a risk of a correction; supercooling there may be a rebound. The expansion of bandwidth (upper and lower rail spacing) indicates increased volatility, while the narrowing of bandwidth indicates that the market may usher in explosive changes.
Volume: Volume reflects the degree of market participation and heat, is an important aid to the analysis of trends. In general, a price rise accompanied by an increase in volume indicates strong buying power and the trend may continue; if the price rises but the volume falls, it may indicate a lack of momentum, a rise or a slowdown or reversal. Similarly, when the price falls with a large volume, the selling pressure is obvious, downward or sustained; if the volume shrinks in the downtrend, it may be close to the bottom opportunity. Pay attention to the divergence between price and volume (e. g., price hits new highs and volume does not hit new highs) to determine potential turning signals in advance.
3. support/resistance and trend determination
trend judgment one of the core aspects of technical analysis is the identification of current market trends. Simply put, an uptrend means that prices continue to make higher highs and higher lows, a downtrend continues to make lower highs and lower lows, and a sideways trend means that prices fluctuate repeatedly within a certain range. For example, in an uptrend, as long as the highs and lows continue to move up, investors will mainly "go long"; in a downtrend, they will mainly "go short. Trend lines or moving averages can be used to assist in judgment: when the price runs above the upward trend line for a long time, the trend continues; if it falls below the trend line, it may turn to consolidation or reversal.
Support and resistance levels: As mentioned earlier, support/resistance is an important reference for judging the buying and selling point. For example, when the London silver price is close to the historical low, it tends to form a buying support; when the price approaches the previous high, it encounters a fall in selling pressure. In a range-bound market, you can buy near the support and sell near the resistance; and when the breakout pattern occurs (e. g., the price closes above the resistance level), you can chase the trend, because the breakout often brings accelerated volatility.
graphic form: Common inversion or continuation patterns, such head and Shoulder Top/Bottom, double top/double bottom, triangle finishing it also appears frequently in the precious metals market. For example, the top of the head and shoulders tends to appear at the end of an uptrend, indicating that the failure of the upward momentum will turn to a decline, while the double-bottom pattern is common at the end of the decline, indicating a reversal of the rise. Triangle finishing generally occurs in the market volatility stage, the market in the convergence after the upward or downward breakthrough and large fluctuations. Price turning points can be captured through morphological analysis, which can be used in conjunction with technical indicators to further confirm signal accuracy.

4. actual combat operation steps and strategies
Identify trends and time periods: First open the daily (D1) or 4-hour (H4) chart of precious metals to roughly determine the direction of the current trend (up, down or consolidation). Make sure to analyze multiple time periods: the daily line is used for general trend judgment, and the hourly line can be used to find accurate entry points.
Draw key trend lines and support/resistance: mark the upward or downward trend line on the chart, identify the recent major highs and lows, and find the support and resistance lines. Mark the important price ranges, and these key levels will determine the subsequent trading strategy (such as range trading or breakout trading).
Application indicator confirmation signal: Load indicators such as moving averages, RSI, MACD, etc., combined with price pattern analysis. When the price is close to the support level and the RSI is oversold, the MACD bottom gold fork, you can consider buying. At this time stop Loss the point can be placed below the support or above the resistance to control the risk.
Develop a trading plan: Each trade should have a clear entry, stop loss and target. Use support/resistance to do range trading, buy stop loss slightly below support, sell stop loss slightly above resistance; trend trading, to step back on the trend line or MA to do long/short as the basis, while setting the appropriate take profit.
Risk Management: Control positions and leverage ratios, not full positions. It is generally recommended that a single loss not exceed 1-2% of the funds. In the event of breaking news or unusual volatility, it is important to reduce your position in a timely manner or set up a position to prevent a burst. Moving Stop Loss. For example, in a one-sided market, when the float reaches a certain multiple, the stop loss can be adjusted to the cost price to lock in no loss.
Each strategy has its applicable time: when the trend is obvious, the homeopathic strategy of "buying up and selling down" can be used; when the market is consolidating, the range strategy of "selling high and selling low" can be used; and when the price breaks through the key position, it can decisively follow the breakthrough direction to build a position. Novices can practice more in the simulation board in combination with the above steps, and continue to learn market dynamics, improve practical experience.

5. London Gold and Silver Market Features and Trading Tips
london gold (spot gold) and London silver (spot silver) are the world's important precious metals trading varieties, the market liquidity is high, almost. 24-hour continuous trading. It should be noted that London gold and silver prices are often affected by global economic indicators, dollar movements, geopolitics and other factors.London gold daily in Beijing time 19:00-23:00 the most volatile period of overlap with the U.S. market. Newcomers should pay attention to the financial calendar for these periods (e. g., Fed resolutions, non-farm payrolls data, etc.) and combine technical analysis to advance the layout.
When trading, you should choose a reliable compliance platform (such as a precious metals broker that supports MT5 trading) and use the real-time market and analysis tools provided by the platform. Many platforms will integrate free quotes software to provide global real-time quotes and technical charts for London gold/silver. It is recommended that beginners use simulated account operations first, familiarize themselves with the trading mechanism and analysis process, and then gradually enter the real offer.
Anyway, technical analysis emphasizes the interpretation of prices and charts. It cannot predict all future market conditions, but it can be used as a powerful tool to assist decision-making. By systematically learning the above basic concepts and operating methods, combined with an understanding of the characteristics of the London gold and silver market, investors can better grasp the trend of precious metals prices and make rational trading decisions. Also keep in mind that technical analysis needs to be used in conjunction with rigorous risk management to avoid over-trading or reliance on a single signal. As long as you practice and continue to learn, you can make continuous progress on the road of precious metal technical analysis.
(All the views in this article are for reference only and do not constitute investment advice. Investment is risky and you need to be cautious when entering the market.)