


How to do more when the gold speculation in London meets the second gold fork of MACD index
2026-11-16 17:16|31 views
The fluctuation of gold price is never a straight line, but it takes a very long time to complete. Sometimes even if the overall trend is an upward pattern, there will be multiple periodic declines and shocks in the middle. Once this situation lasts longer than investors expect, people will have doubts about doing long operations, so what should we do when speculating in London gold meets the second golden fork of the MACD indicator?
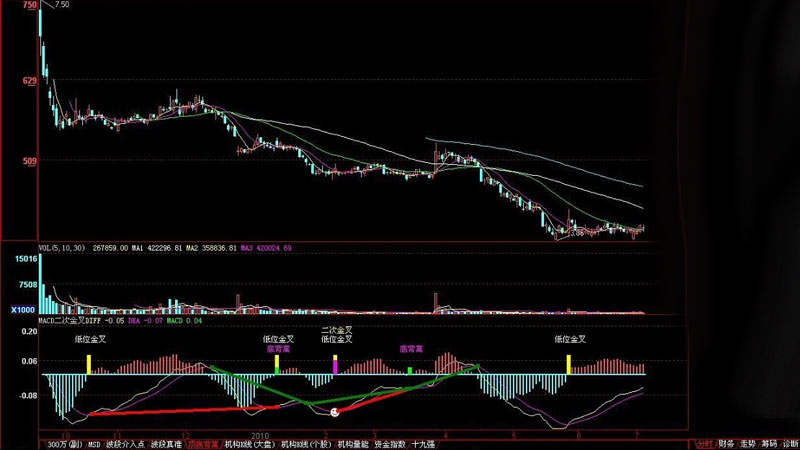
The second gold fork does more operations.
The K-line chart of the gold price trend can help everyone understand the price performance more clearly and comprehensively. There is a kind of MACD indicator in the K-line chart. When the MACD indicator has a second golden cross, it is a good time to do more. When the MACD indicator is low, the price may not be able to rise, but the probability and certainty of the MACD indicator low second gold fork rise can be higher.
Because after the previous golden fork, although the short again small attack, resulting in another dead fork, but the short attack in front of the second golden fork suffered a rout, resulting in the eruption of the long force. However, the technical situation of the second golden fork has certain key points: the closer the second golden fork is to the previous golden fork, the better; The position of the second golden fork is higher than that of the previous golden fork. When MACD index is the second golden fork, if there are multiple forms of K-line, such as two positive and one negative, platform upward breakthrough, etc., the success rate will be higher.
actual operation
In the daily K-line chart of spot gold prices from July to October 2012, the MACD indicator has a golden cross. This is a signal to do more. Investors should be more sensitive to this situation and then intervene in time to do more. Prices then rose and continued to rise, but then rose with insufficient strength.
At this time, the price fell back, and the force of this wave of pullback was not strong, and the price began to stabilize near the 30-day moving average. When the second wave of price correction, the bottom K line appeared near the 30-day moving average, and then the price again stood on the 5-day and 10-day moving average, the moving average appeared a long arrangement, and the colleague MACD index appeared a second golden cross, which means that a new wave of rise is about to begin, so it is very good to do more at this time.