


How to Do More on the Green Column Bottom Divergence of the Gold MACD Indicator
2026-11-16 17:16|36 views
Speculation in London gold requires a comprehensive understanding of the fundamentals that affect the rise and fall of the gold price, but if there is not enough margin of safety and the purchase price is too high, then the profit space will be continuously compressed, so the technical aspects of the gold price must be constantly observed. There will be a MACD indicator in the gold price trend, so how do we speculate on the green column bottom deviation of the London gold MACD indicator?
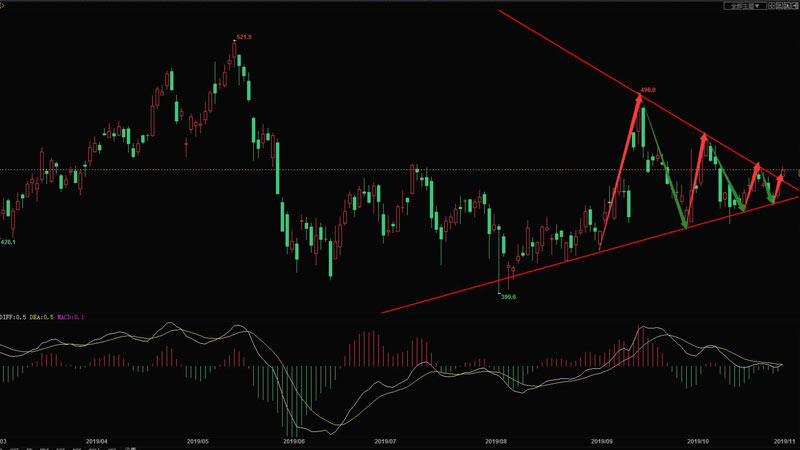
The bottom of the green column divergence of the MACD indicator
Gold speculators need to pay attention to the use of this technical aspect, often have to wait until the MACD index of the green column bottom deviation is completed, the MACD index will see the bottom rebound, so the MACD index of the green column bottom deviation of the long signal will be more obvious.
In the spot gold daily K-chart and MACD index from the end of May to October 2010, after several waves of rise, the price of gold fluctuated at a high level, and the MACD index repeatedly appeared dead fork and gold fork at a high level, which indicated that the price would fall in the future. Sure enough, after that, a big negative line fell, and at the same time fell below the 5-day, 10-day, and 30-day moving average. At the same time, the MACD indicator appeared a dead fork at the high level, which means that the falling market began, so investors must not do much at this time, even if they already have many orders in their hands, they must sell them as soon as possible.
Do more operations
When the shady line fell, the price began to fluctuate and fall, but the decline was not very strong. When the MACD index fell in a wave, the green column was very long, and then the price continued to fall. Although the price kept reaching new lows, the green column did not grow longer. Obviously, this is the deviation of the green column bottom of the MACD index.
The deviation of the green column bottom of the MACD indicator in the gold price trend means that the price will not fall too much, so investors with empty orders should take profits as soon as they find a bottoming K line. When the big Yin line fell, there was a small Yang line, which indicated that the price had stabilized. Then the price continued to close and stood on the 5-day moving average. At the same time, the MACD index showed a golden cross, indicating that the price was going to rise. This is a good time to do more.