


Tangent analysis techniques in gold investment.
2026-11-16 17:16|35 views
In gold investment, tangent analysis techniques are an important means of technical analysis, by drawing and analyzing the trend line, support line and resistance line and other tangents, investors can predict the trend of gold prices, to develop a reasonable investment strategy.
The following will detail several common tangent analysis techniques in gold investing to help investors better grasp market dynamics and make informed investment decisions.
Overview of 1. Tangent Class Analysis Techniques
Tangent analysis techniques mainly include trend lines, support lines and resistance lines. These lines help investors identify market trends and potential inflection points in price movements by connecting key points in the price chart.
1. Trend line
A trend line is a line formed by connecting the highs or lows in a price chart to show the overall trend of the market.
An uptrend line connects a series of gradually rising lows, indicating that the market is in an uptrend. The uptrend line is usually used as a support line, and the price may rebound after hitting this line.
A downtrend line that connects a series of progressively lower highs, indicating that the market is in a downward trend. The downtrend line usually acts as a resistance line, and the price may fall back after hitting the line.
2. Support line
The support line is the price level at which the price, supported by the buyer's strength, cannot continue to fall and rebound during the decline. The support line is usually determined by connecting several low points.
3. Resistance line
Resistance line refers to the price in the process of rising, by the seller's power to stop, can not continue to rise and fall back. Resistance lines are usually determined by connecting several high points.
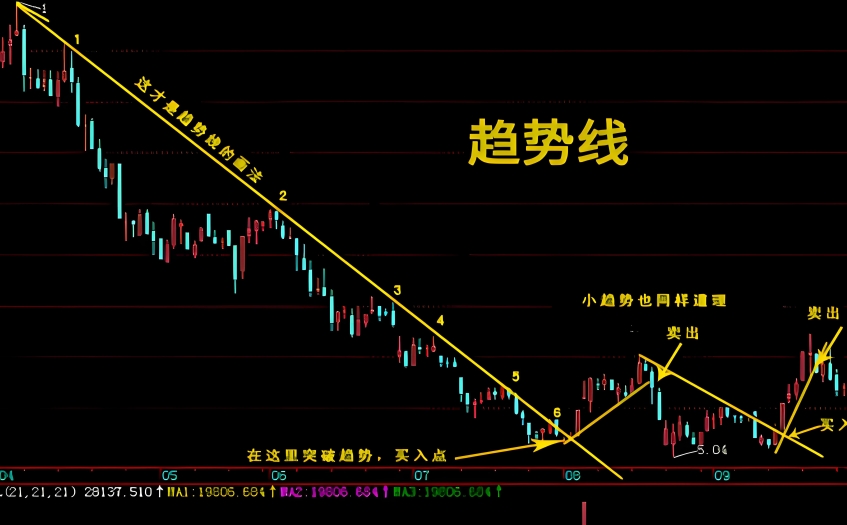
Drawing and Application of 2. Trend Line
1, the trend line drawing.
To draw a trend line, you need to pay attention to the following points:
Select obvious highs and lows: Connect the obvious highs or lows in the chart to ensure that the trend line is representative.
Try to maintain the validity of the trend line: the trend line needs to pass through as many points as possible to ensure its validity and reliability.
Adjusting the trend line: As the market develops, the trend line may need to be adjusted to accommodate new price fluctuations.
2. Application of trend lines
Trend lines can help investors identify the overall trend of the market and develop corresponding trading strategies:
Confirm trend direction: By observing the direction of the trend line, determine whether the market is in an uptrend, downtrend or sideways.
Find a buying and selling point: In an uptrend, consider buying when the price hits an uptrend line; in a downtrend, consider selling when the price hits a downtrend line.
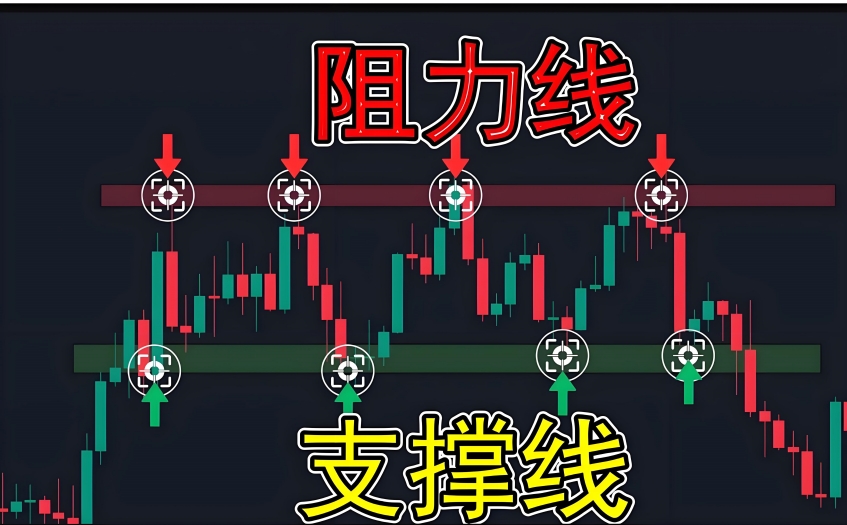
Identification and Application of 3. Support Line and Resistance Line
1. Identification of support lines
Identifying support lines requires focusing on levels that the price has touched several times during the decline but failed to break through:
Multiple hits: The price has repeatedly touched a certain level but failed to break through, indicating that the level has a strong supporting effect.
Volume change: when the price touches the support line, if the volume is significantly enlarged, the effectiveness of the support line is stronger.
2. Identification of resistance lines
Identifying resistance lines requires paying attention to levels that the price has touched several times during the rise but failed to break through:
Multiple hits: The price has repeatedly touched a certain level but failed to break through, indicating that the level has a strong resistance effect.
Volume change: when the price touches the resistance line, if the volume is significantly enlarged, the effectiveness of the resistance line is stronger.
3. Application of support line and resistance line
The application of support and resistance lines in trading mainly includes the following aspects:
Look for buying and selling points: Consider buying near the support line and selling near the resistance line.
Set Take Profit and Stop Loss bits: Support and resistance lines can be used as stop-loss and take-profit references to help investors control risk and lock in returns.
Judging the trend reversal: the price breaks through the support line or resistance line, which may indicate a reversal of the market trend. At this time, investors need to pay special attention to market changes and adjust their trading strategies in a timely manner.
Tangent analysis techniques play an important role in gold investment. By mastering the drawing and application of trend lines, support lines and resistance lines, investors can better grasp market trends, find suitable buying and selling opportunities, and effectively manage investment risks.