


How to look at the timing of entry and exit from the K line?
2026-11-16 17:16|21 views
K-line chart (or candle chart) is one of the most commonly used technical analysis tools in financial markets, widely used in stocks, foreign exchange, futures and other trading markets. It helps traders to judge the trend of the market and possible future movements by showing the price changes over a certain period of time.
How to look at entry and exit timing from the K line is one of the core skills that every technical analysis trader needs to master. Junan International will discuss in detail how to identify the right time to enter and exit from the K chart to help investors make more accurate trading decisions.
1. The basic composition of the K-line chart
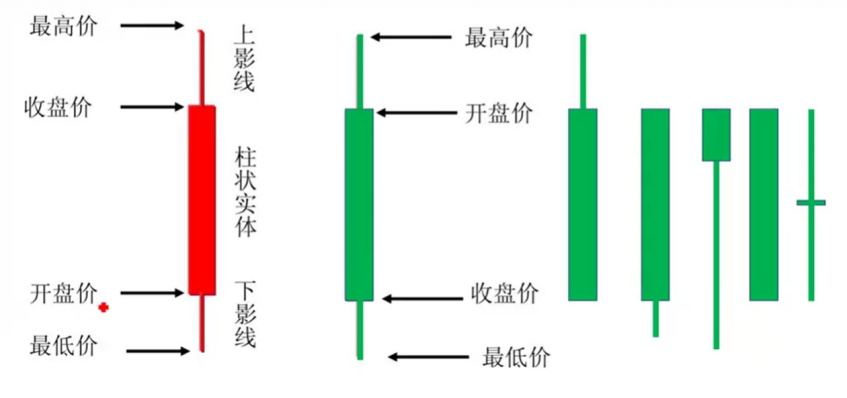
Before we begin to analyze how the K-line can help us make entry and exit decisions, we must first understand the basic composition of the K-line chart. Each K line represents market price fluctuations over a certain period of time and usually contains the following four elements:
Opening price (Open): The first transaction price in a certain period of time.
Close (Close): The last transaction price in a certain period of time.
Highest Price (High): The highest transaction price in a certain period of time.
Lowest price (Low): The lowest transaction price in a certain period of time.
With these data, the K-line chart shows the range of price movements and the sentiment of the market. If the closing price is higher than the opening price, it usually indicates that the market is in an uptrend (positive line); otherwise, it indicates that the market is in a downtrend (negative line). The shape, length and color changes of the K line can often provide us with long-short signals in the market.
2. How to see the timing of entry from the K line
The timing of entry is the focus of every trader's attention, and choosing the right time to enter is often the key to success. Identifying effective entry signals from the K-line chart can help us get the right buying opportunity in the market.
2.1 recognition of trend reversal signals
One of the most common entry signals on the K-line chart is a trend reversal, which usually occurs with certain K-line patterns that reflect changes in the mood of market participants. Here are a few common reversal signals:
2.1.1 Engulfing morphology (Engulfing Pattern)
There are two types of engulfing patterns: bullish engulfing and bearish engulfing. Bullish engulfing occurs in a downtrend, which consists of a small yin line followed by a larger yang line, the latter completely "engulfing" the former. A bearish engulfment, on the other hand, occurs in an uptrend and is the opposite of a bullish engulfment, usually consisting of a small positive line followed by a larger negative line, with the latter engulfing the former completely. The engulfment pattern indicates that the sentiment of the market has changed and the price may reverse.
2.1.2 Hammer line (Hammer) and upper suspension line (Hanging Man)
The two K-line forms are similar in shape, with both having longer downhatching and shorter entities. The hammer line generally appears at the bottom of the downtrend, meaning that the seller's power is gradually weakening and the price may reverse the rise. The hanging line, on the other hand, usually appears at the top of the uptrend, meaning that the buyer's power is beginning to run out and there may be a reversal down.
2.1.3 Shorts (Doji)
Doji is a K-line with almost equal opening and closing prices, in the form of a cross. The emergence of Doji usually means market hesitation and uncertainty. When Doji appears at the end of an up or down trend, it tends to signal a reversal of the trend.
2.2 Support and Resistance Breakthrough
In a K-line chart, the price fluctuates between specific support and resistance levels. Support levels are usually areas where prices fall to a certain level and then stop falling back, while resistance levels are areas where prices rise to a certain level and then are blocked from falling back. When the price breaks through these important support or resistance levels, it usually means a change in the market trend.
Breakthrough support level: When the K line breaks through the support level, it usually means that market sentiment turns pessimistic, sellers dominate, and prices are at risk of falling further.
Break resistance level: When the K-line breaks through the resistance level, it usually means that market sentiment turns to optimism, buyers dominate, and prices may continue to rise.
2.3 take advantage of the situation
When the market shows a clear upward or downward trend, homeopathic trading is a common entry strategy. The K-line chart can help us confirm the existence of the trend and choose the appropriate entry point. For example, in an uptrend, investors can take advantage of the situation by waiting for a correction in the K-line chart and choosing to enter near the support level.
3. How to see the timing of the appearance from the K line
Determining the right timing is another key to investment success, and while timing is crucial, it is equally important to be rational in the market and avoid greed. The following describes several common ways to identify the timing of appearances through the K-line.
3.1 trend reversal signal
As with the timing of the entry, the trend reversal signal can also be used as the basis for the exit. When there is a trend reversal in the market, investors should consider closing positions or stopping losses. Common trend reversal signals are engulfing patterns, hammer lines and hanging lines.
3.2 use stop-loss and take-profit points
In every trade, setting stops and take profits is an important means of managing risk and locking in profits. Through the K-line chart, investors can choose the appropriate stop loss and take profit position. For example, you can place a stop loss near the high or low of the previous wave of volatility to prevent excessive losses when the market reverses.
3.3 the excessive expansion of K line
When price volatility is excessive and the K line is extreme, it may indicate that the market has overreacted and the trend may end or adjust. For example, in a strongly rising market, there have been several consecutive long positive lines, and investors should be alert to possible market corrections. At this point, the reasonable timing of the appearance may be right behind these over-extended K-lines.
3.4 Market Convergence
Market convergence usually indicates that the market is about to enter a consolidation phase. On the K-line chart, the price will oscillate within a certain range, as shown by the gradual narrowing of the volatility of the K-line. At this time, investors can observe the convergence of the K line, in advance to determine the market may enter the consolidation, and make timely exit decisions.
How to look at the timing of entry and exit from the K line? Through the interpretation of signals such as the shape of the K line, support and resistance, and trend reversal, investors can accurately grasp the trend of the market and choose the right timing of entry and exit. Mastering the analysis method of K-line chart can not only improve the success rate of trading, but also help investors better manage risk. Through continuous learning and practical operation, traders can constantly improve their technical analysis skills and gain greater competitive advantage in the market.