


moving average
2026-11-16 17:16|24 views
moving average, also known as the "moving average" (MA), uses the principle of "moving average" in statistics to curve the price parity over a period of time, thus reflecting the average cost changes in the market over a period of time. For example, the 5-day moving average (MA5) is the line formed by the average price for five consecutive days.
System settings for moving average groups
the multiple moving averages are arranged together according to a certain regularity, which can form a moving average group system that is more helpful for analysis. The moving average group system has some special setting methods and usage methods.
When analyzing with the moving average system, there are several common arrangements of parameters:
1. Arrange according to the equal span arrangement: MA5, MA10, MA20, MA30, MA60
2. Arrange according to Fibonacci arrangement: MA5, MA8, MA13, MA21, MA34, MA55. .. On the basis of these two arrangements, the average of the three parameters of annual line and semi-annual line MA125, MA200 and MA250 can be used on the graph of large period.
Application of moving average system
1. Judging the market rhythm according to the arrangement state
the arrangement state of the moving average system is generally convergent, divergent and parallel.
a. The state of convergence indicates the process of digesting the original kinetic energy or accumulating new kinetic energy after the market has experienced a unilateral trend, and the longer the convergence time, the greater the kinetic energy generated;
b. The divergent state is the prelude to the generation of explosive kinetic energy after convergence.
c The parallel state indicates that the market's operating momentum has erupted in one direction, triggering a new unilateral operating trend.
Tip: In the rhythm of unilateral market operation, the cycle of these three states is: convergence-divergence-parallel-convergence, while in the consolidation market, it is reflected in the cycle of convergence-divergence-convergence until the breakthrough occurs.
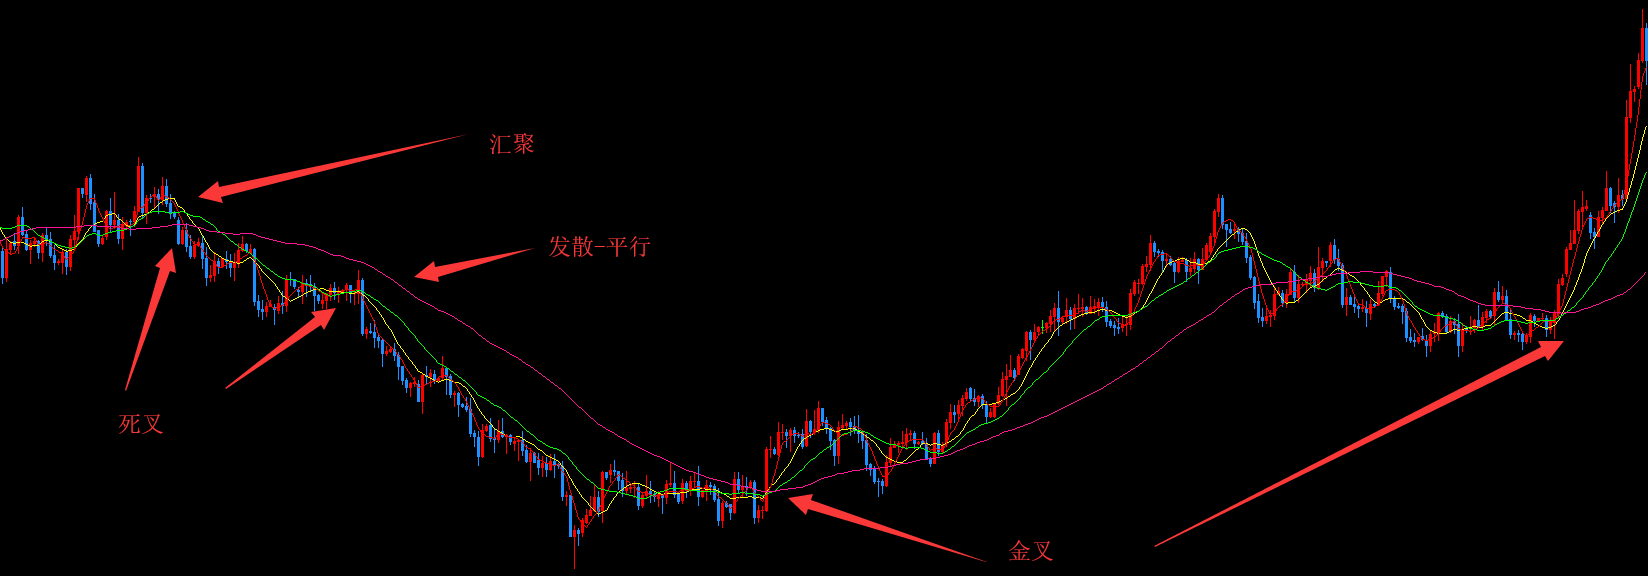
2. The indicator signal of the "cross" of the moving average.
When the shorter-term moving average crosses the longer-term moving average from bottom to top, it is called "golden fork" and the price rises; when the shorter-term moving average crosses the longer-term moving average from top to bottom, there is a "dead fork" and the price falls. Both gold and dead fork signals provide mid-line or short-term trading opportunities and position signals.
Note: Since the moving average is the arithmetic average of a few days or even dozens of days, the average cost of the market, so as the basis for trading, but also has a certain lag.
3. The support and resistance of the moving average.
When the price moves up or down, there will be large or small pressure or support when it encounters an important moving average. The larger the parameters of the moving average, the greater the role of pressure and support.