K-line Basics
2026-11-16 17:16|37 views
The K-line, also known as candle chart, graphically represents the process and results of the increase and decrease and transformation of the forces of both sides in the simplest way. The K-line chart is a kind of technical analysis. It was first created by the Japanese in the 19th century and originated from the rice market trading in the Tokugawa shogunate era (1603-1867) in the 18th century in Japan. It is used to calculate the daily rise and fall of rice prices, at that time, the Japanese rice market merchants used to record the rice market and price fluctuations, including the opening price, closing price, the highest price and the lowest price, yang candle on behalf of the day up, yin candle on behalf of the market down.
K line chart patterns can be divided into reversal patterns, finishing patterns and gaps and trend lines. The post-K chart was introduced into the financial markets because of its delicate and unique way of plotting. The drawing of the K-line chart in the financial market contains four data, namely, the opening price, the highest price, the lowest price, and the closing price. All the K-lines are developed around these four data, reflecting the general trend and price information. If you put the daily K-line chart on a piece of paper, you can get the daily K-line chart, and you can also draw the weekly K-line chart and the monthly K-line chart.
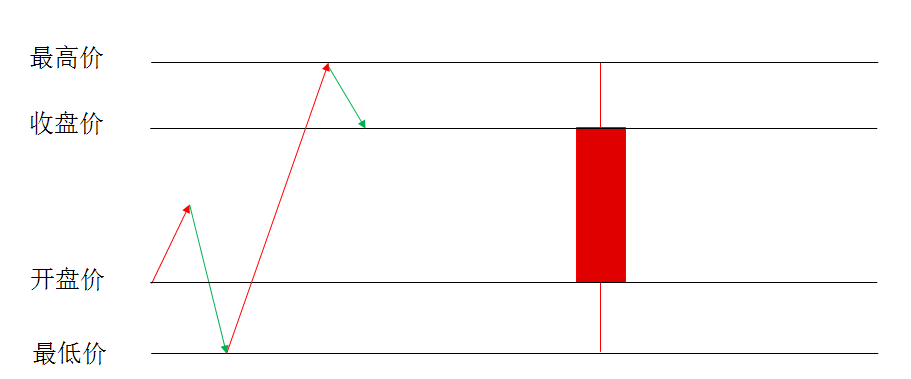
So the day price trajectory, can be converted to K line, K line how to draw it?
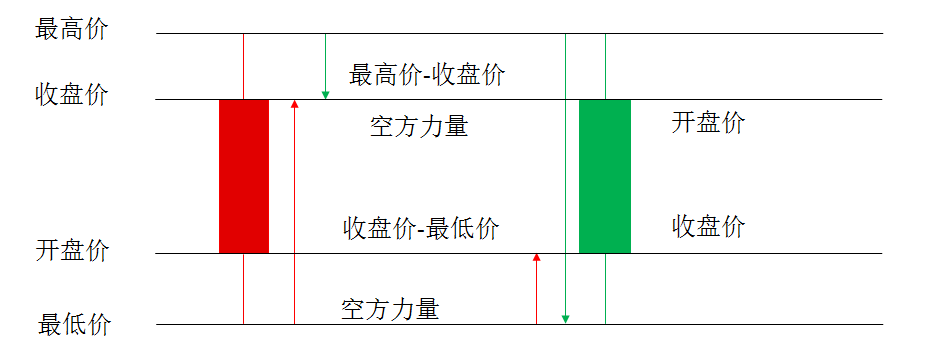
The K-line, which shows the power of both sides of the long and short game, can be simply understood from this perspective:
Seller: Highest point-closing price = short-side power
Buyer: Closing Price-Lowest Price = Multi-party Power