


Dark Cloud Cover and Piercing Pattern
2026-11-16 17:16|53 views
Dark clouds cover the top, is one of the more common top-to-shape charts on the K-line chart. This pattern consists of two K-lines, which generally appear in the rising trend after that, it may also appear at the top of the horizontal adjustment interval in some cases. Dark clouds often occur at the top of a rising market, consisting of two K lines, one yin and one yang, which is a bearish reversal signal.
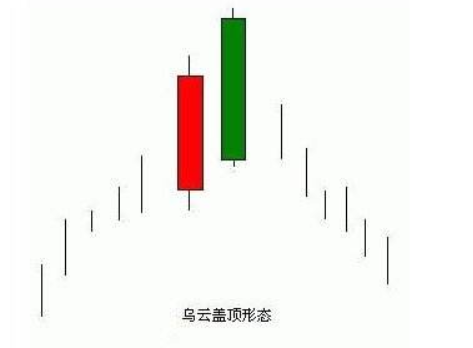
morphological analysis
The trend of dark clouds can be divided into the following different components:
(1) The left side of the strong positive line-before the occurrence of the pattern, the market is in an upward trend, one day, suddenly appeared a strong solar line, to undertake the previous rise in the market, showing that many parties fully grasp the initiative.
(2) The right side of the high open line-the next day, the market at the opening of the market up and high open, but the market did not continue to rush up, but the shock downward, closed near the lowest price of the day, and the closing price obviously down into the first day of the entity.
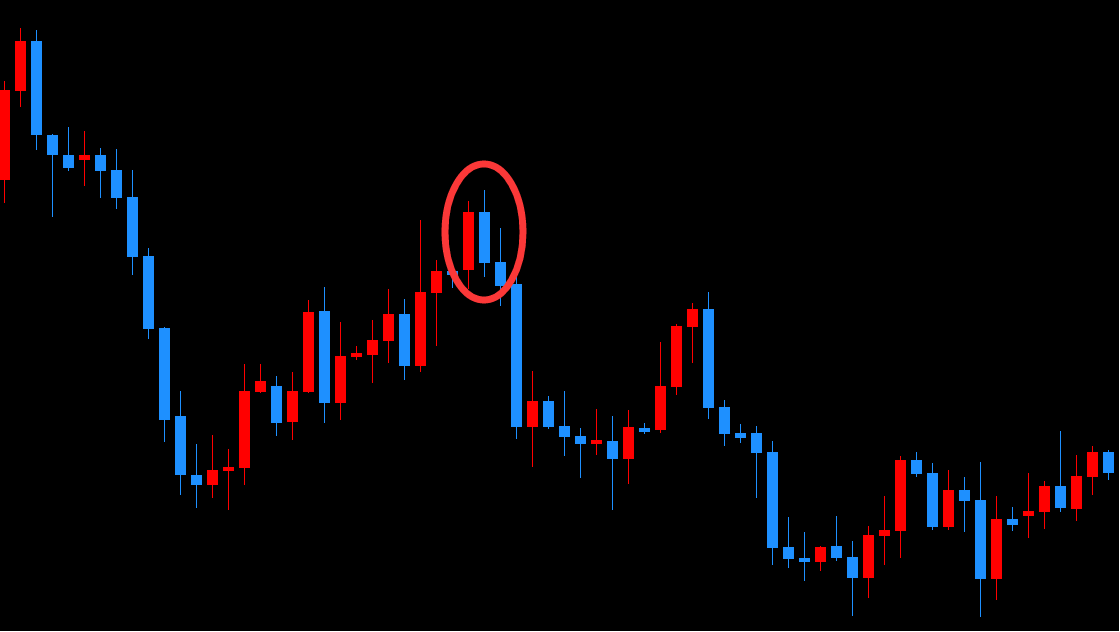
Key points
1. The second K-line should be higher than the highest price of the first K-line, but the closing price should fall sharply and reach less than half of the solid part of the first K-line, otherwise the analysis is of little significance. The more the second K-line entity penetrates into the first K-line entity, the more likely it is that market conditions will peak and fall back.
2. The second K-line broke through the obvious resistance level in the opening stage and then turned down, indicating that the bulls were weak in their upward attack and the signs of the general trend peaking have been revealed.
3. The volume of the second K line at the beginning of the opening is also a very important indicator. The greater the volume, the more investors lurking in it, the more likely the market will turn.
Contrary to the top of the dark cloud cover, the piercing pattern is a bottom reversal pattern, which generally appears in the down market, and there are also two K lines of yin and yang.
Penetration Morphology also known as the dawn. After a period of decline, a big yin line is closed, and then a big yang line is closed at a price 1/2 or above the yin line, which means that the bulls are strong. But this is just the first light, not a strong buy signal
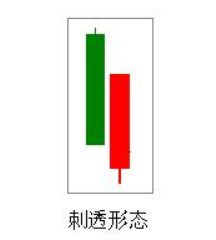
We look at two main points when analyzing the effectiveness of puncture patterns:
1. The opening price of the second day is lower than the lowest price of the first day
2. The closing price of the second day should be higher than the midpoint of the first day's yin line entity, the more the yang line entity exceeds the yin line 1/2, the stronger the turn signal, if the formation of yang package yin form, the greater the probability of success.
Key points
1, is an important sign to determine whether the market has formed a bottom, usually in a downward trend, it is recommended to confirm the pattern.
2. The entity closing price of the next day's overcast line should reach half of the length of the previous day's overcast line. If not, the market trend is not clear, continue to wait.